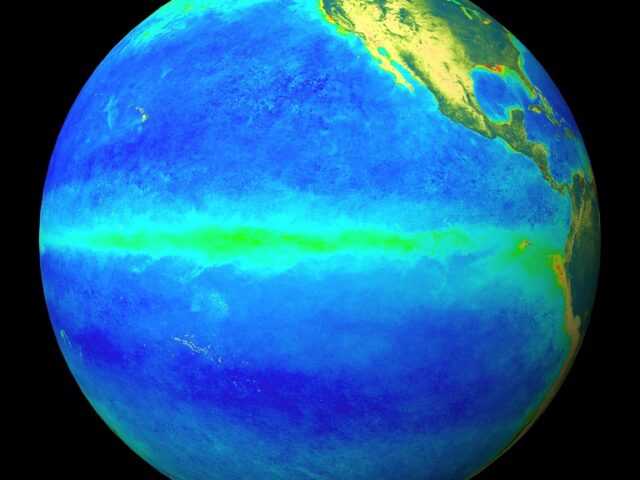
The strong 2015 El Niño event is near its peak. While sea surface temperatures remain close to record-high values, some El Niño indicators are now showing signs of easing. However, the current El Niño is likely to persist well into 2016. El Niño indicators, notably sea surface and sub-surface temperatures, westerly wind anomalies in the central Pacific, and cloudiness near the Date Line, remain well above El Niño thresholds.
The Southern Oscillation Index (SOI) has eased back into neutral values, though this may be short-lived: the SOI tends to be more variable during the northern Australian wet season (October–April). Model outlooks and the strength of the current event suggest El Niño thresholds may continue to be exceeded well into the southern hemisphere autumn.
The 2015–16 El Niño is strong, and likely to rank in the top three events of the past 50 years. Presently, several key indicators fall short of their 1997–98 and 1982–83 values, both in the ocean (e.g. sub-surface temperatures, which have peaked around +8 °C this year, compared to +12 °C in 1997–98), and atmosphere (e.g. SOI, for which monthly values peaked around −20, while 1982–83 had several months at −30).
El Niño’s influence on Australian rainfall is variable at this time of year, with both wetter and drier summers observed in past events depending on how quickly the event breaks down.
However, on average an El Niño summer brings below-average rainfall across northern Queensland, and a slight drying influence across the southeast of Australia. Conversely, inland Western Australia often sees above-average rainfall at this time of year during El Niño.
The Indian Ocean Dipole has little influence on Australian climate between December and April.
However, Indian Ocean sea surface temperatures remain very much warmer than average across the majority of the basin. This basin-wide warmth may provide extra moisture for rain systems across Australia.


