In April 2018, the ICO composite indicator decreased by 0.4% to an average of 112.56 US cents/lb, with the daily price ranging between 110.49 US cents/lb and 114.73 US cents/lb.
Prices for all three Arabica groups fell in April 2018, though the largest month-on-month decrease occurred for Brazilian Naturals, which fell by 0.9% to 118.76 US cents/lb.
The monthly average for Robusta, on the other hand, increased by 0.1% to 88.31 US cents/lb.
Global coffee exports amounted to 10.81 million bags in March 2018, compared with 10.91 million in March 2017, driven by decreased shipments of Arabica, particularly Colombian Milds. Exports in the first six months of coffee year 2017/18 decreased by 0.6% to 59.96 million bags compared to the same period in the last coffee year.
The monthly average of the ICO composite indicator fell for the third consecutive month in April 2018, decreasing by 0.4% to 112.56 US cents/lb. The daily composite indicator spent all but the final two days of the month below 114 US cents/lb, ranging between 110.49 US cents/lb and 113.71 US cents/lb. However, it rose to 114.66 US cents/lb on 27 April and increased further to 114.73 US cents/lb on the last day of the month.
Prices for all three Arabica groups decreased in April 2018. The largest decline occurred in the average price for Brazilian Naturals, which fell by 0.9% to 118.76 US cents/lb while Other Milds decreased by 0.5% to 134.34 US cents/lb.
Colombian Milds fell by just 0.1% to 139.29 US cents/lb, with further downward movement limited by expectations for a smaller Colombian harvest in 2017/18. As a result, the differential between Colombia Milds and Other Milds increased by 12% to an average of 4.95 US cents/lb.
The monthly average Robusta price rose by just 0.1% to 88.31 US cents/lb, reflecting the short-term tight supply situation just before the arrival of the new Brazilian Robusta crop.
The average arbitrage in April, as measured on the New York and London futures markets, fell by 2.4% to 40.81 US cents/lb. Additionally, intra-day volatility of the ICO composite indicator price decreased by 0.3 percentage points to 4.0%.
World production in 2017/18 is estimated at 159.66 million bags, 1.2% greater than last year. Output from South America is expected to decline by 6.1% to 70.59 million bags. However, output from the remaining regions will more than offset this decrease. Production in Africa is estimated 3.2% higher at 17.66 million bags, Asia & Oceania 10% higher at 49.49 million bags, and Mexico & Central America, 7.1% higher at 21.92 million bags.
Total exports in March 2018 declined by 0.9% to 10.81 million bags compared to the same month one year ago. This was driven by decreased shipments of Arabica, particularly Colombian Milds.
Exports for October 2017 through March 2018 were lower than those from the same period one year ago in each month except February.
The lower volume in March has been significant enough to lead to a decrease of 0.6% to 59.96 million bags in the first six months of coffee year 2017/18.
Exports of Colombian Milds were 11.5% lower in March 2018 at 1.16 million bags and 10.1% lower at 7.34 million bags for the first six months of 2017/18. Compared to one year ago, shipments from Colombia were 10.7% lower at 1.04 million bags in March 2018 and 10.6% lower at 6.70 million bags in the first six months of coffee year 2017/18.
This is due to the expected reduced output from Colombia as excessive rains are reported to have dampened prospects for its production in 2017/18, which is estimated at 14 million bags.
Output during the first half of crop year 2017/18 reached 7.32 million bags as reported by the National Federation of Coffee Growers of Colombia. This is 8.1% less than the volume of output during the same period one year ago, but similar to the volume during the first six months of 2015/16 when total production reached 14.01 million bags.
Exports of Other Milds also fell in March 2018 to 2.49 million bags, 1.3% lower than in March 2017. However, Other Milds have fared much better than the other two Arabica Groups during the first six months of crop year 2017/18 as shipments of this group reached 12.49 million bags, 5.8% higher than the same period one year ago.
Compared to one year ago, shipments from Honduras in March 2018 and in the first six months of the crop year have increased by 7% to 0.86 million bags and 11.8% to 3.35 million bags, respectively. Honduras’s output is estimated to increase by 12% to 8.35 million bags in 2017/18, creating a larger availability for export, since domestic consumption remains relatively small.
Brazilian Naturals experienced a decline of 6.8% to 2.68 million bags in March 2018 while shipments of this group were 18.14 million bags from October 2017 to March 2018, 2.2% lower than the same period one year ago.
Shipments from Ethiopia were 0.26 million bags in March 2018, 4.6% lower than the same month one year ago. However, its exports in the first six months of crop year 2017/18 increased to 1.55 million bags, up 27.6% compared to the same period last year. Ethiopia’s production is estimated 4.8% higher at 7.65 million bags in 2017/18.
Brazil’s total exports decreased by 10.5% to 2.52 million tons in March 2018, compared to the same month one year ago. Between October 2017 and March 2018, it shipped 16.57 million bags, 7.7% lower than the same period one year ago. This reflects the smaller output in crop year 2017/18, which is estimated at 51 million bags.
Compared to March 2017, Robusta exports were 6.7% higher at 4.48 million bags in March 2018. Shipments from October 2017 to March 2018 reached 21.99 million bags, 0.9% higher than one year ago due to lower volume of exports in the first two months of the crop year.
Exports for Vietnam are provisionally estimated at 3.3 million bags in March 2018, 31.9% higher than the same month one year ago, while its total exports for the first six months of crop year 2017/18 are 15.5% higher at 14.46 million bags. While Uganda’s exports declined by 18.7% to 0.33 million bags in March 2018, its shipments for the first six months of 2017/18 are up 3.7% compared to the same period one year ago, reaching 2.34 million bags.
Finally, this month’s Coffee Market Report examines disaggregated data on green Arabica exports to explore the relation between FOB prices at origin and ICO group indicator prices recorded in importing countries.
The analysis uses information contained in Certificates of Origin from Brazil, Colombia, Honduras and Vietnam that allows tracking the unit value of exported coffee on a per-shipment basis at the port of origin.
Figure 5 is a box plot that depicts the profile of the unit values of green Arabica exports from these four countries in coffee year 2016/17. The graph shows the minimum, and maximum unit values for individual coffee shipments and breaks the range in four equal sections. 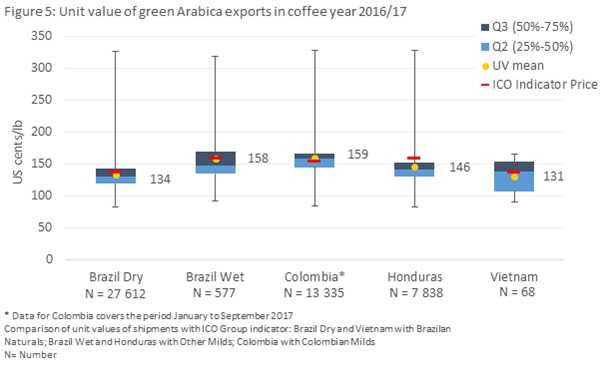
Each of the sections (quartiles) contains 25% of the recorded unit values according to Certificates of Origin. The first and fourth quartiles are indicated by the lower and upper whiskers, while the second and third quartiles are depicted as light and dark blue boxes around the median.
The mean of the recorded unit values (indicated by yellow dots) is compared to the average annual price (shown as red bars) of the three relevant ICO group indicators (Colombian Milds, Other Milds and Brazilian Naturals).
The descriptive analysis reveals two main patterns. First, the mean ICO group indicator prices tracked closely the mean unit values of both dry- and wet-processed Arabica shipments from Brazil, as well as Arabica shipments from Colombia and Vietnam.
Exports from Honduras, however, recorded a lower unit value on average than Other Milds, the relevant ICO group indicator. Within the Other Milds group (which includes growths of coffee from Costa Rica, Guatemala, Honduras, Mexico and El Salvador), Arabica coffee from Honduras was traded at lower prices likely due to market responses in relation to availability and quality.
The second finding is the considerable variation of the unit value around the mean for Arabica exports as indicated by the bracket above and below the mean. The difference between minimum and maximum unit values recorded on the Certificates of Origin ranged from 226 US cents/lb for dry-processed Arabica from Brazil to 245 US cents/lb for wet-processed Arabica shipped from Honduras.
While Arabica from Honduras was traded lower value on average, the variation of the unit value was the largest among the four countries analysed. The variation in unit values for Arabica from Vietnam was significantly lower at only 75 US cents/lb.
The variation is the result of various factors including fluctuations of the world market price for Arabica throughout the coffee year, forward selling, differences in quality and freight costs that depend on shipment volume.
Figure 6 shows the variation in daily ICO group indicator prices in coffee year 2016/17. Throughout the year, prices fluctuated in a relatively narrow band between a maximum and a minimum value. The difference between these two values was 35 US cents/lb for Colombian Milds, 63 US cents/lb for Other Milds, and 56 US cents/lb for Brazilian Naturals. Hence, the fluctuation in the group indicator prices explains only part of the overall variation in unit values of exports. The residual unexplained variation can be attributed to differences in quality of coffee shipped as well as other lesser factors such as freight costs that depend on shipment size.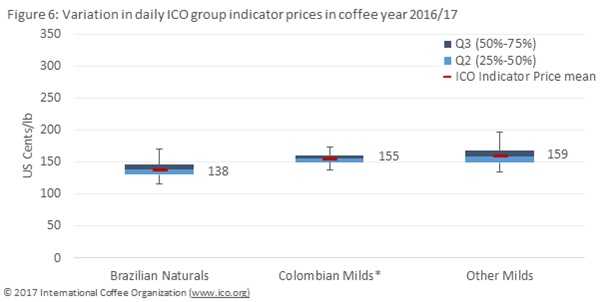 The certificate data also reveals that growers can realise a price premium, for example via product differentiation, higher quality, certification or improved contracts. Coffee shipments with unit values above the maximum ICO group indicator price recorded during coffee year 2016/17, indicate that a premium was realized.
For example, the unit value of 17% of shipments of wet-processed Arabica from Brazil exceeded the maximum ICO group indicator price recorded for Other Milds. Similarly, the unit value of 18% of shipments of Arabica from Colombia was higher than the maximum ICO group indicator price recorded for Colombian Milds. This share, however, is lower at 5% for dry-processed Arabica lots from Brazil and wet-processed Arabica from Honduras.


