SANTA ANA, California – Lead author Dr. MACKENZIE BATALI outlines findings from a recently published paper, “Titratable Acidity, Perceived Sourness, and Liking of Acidity in Drip Brewed Coffee” that illuminate a key specialty coffee flavor attribute.
Beyond contributing either positively or negatively to the reception of the coffee, acidity is also mentioned as a component of other cupping score categories including flavor, balance, and defects; it likely contributes to uniformity and overall score as well.
Among all the factors that can impact coffee flavor, the brewing step specifically has been shown to impact sourness. Recently, University of California Davis (UC Davis) Coffee Center, in partnership with the Specialty Coffee Association’s Coffee Science Foundation and supported by Breville, has launched multiple investigations on sensory and consumer analysis of drip brews spanning the entire range of the Coffee Brewing Control Chart.[1]
In each set of investigations, coffees[2] were brewed to three distinct levels of total dissolved solids (TDS: 1.0%, 1.25%, and 1.5%), three distinct levels of percent extraction (PE: 16%, 20%, and 24%), and various roast levels or brew temperatures.
Why Chemical Explanation Matters: Sourness and Perceived Quality
In our research, the evaluation of coffee taste and flavor differs slightly from typical coffee industry standards, using traditional sensory methodology for descriptive and preference evaluation. At UC Davis, we have a group of students, staff, faculty, and community members who participate regularly as trained tasters for our descriptive analysis panels.
For each separate experiment, we convene a panel of 8–14 of these coffee lovers and train them in depth on the appropriate samples. Tasters are also trained on reference standards for particular attributes, many of which are based on the World Coffee Research Sensory Lexicon.
This serves to align all panelists in their expertise of sensory attributes relevant to coffee, and to treat the panelists as a uniform instrument for quantitative evaluation.
Our descriptive analysis panelists, blind to the coffee treatments, are asked to evaluate specific sensory attributes on a scale of intensity, scored from 0 (not observed) to 100 (extremely intense).
These results are solely an objective observation of the sensory attributes present and absent in particular coffees, with no evaluation of liking or quality.
Separately, consumer preference evaluations determined liking and drivers of liking of different coffee samples.
In this study, 119 consumers of black coffee were recruited to build a representative sample of average coffee drinkers; all consumers tasted the same samples as the descriptive analysis panel, once again blind to the treatments, but instead rated coffee as to their enjoyment of each sample and preference of specific attributes.[3]
In all our Brewing Control Chart experiments, we notably found that “sour taste” exhibited the largest magnitude of change by brewing the same beans differently. High TDS, low PE coffee was most sour regardless of roast or brewing temperature, while low TDS, high PE coffee was perceived as least sour, observed regardless of brew temperature or roast level.
Consumers agreed—evaluation by untrained panelists showed that “acidity liking” changed drastically with brewing parameters, with low PE, high TDS coffees more likely to be perceived as “too acidic” and high PE, low TDS coffees as “not acidic enough,”[4] consistent with where the trained tasters detected much sourness or little sourness, respectively.
Thus, both descriptive analysis and consumer preference testing indicates that understanding chemically how sourness is impacted by brewing could help coffee brewers more easily manipulate an attribute that will likely contribute heavily to perceived quality.
Understanding and Applying pH and Titratable Acidity as Measurement Tools
Our previous work has established TDS and PE as simple-to-measure metrics that can start to predict coffee quality. With our work, we hoped to add to that arsenal and establish how pH and titratable acidity measurements can predict sensory quality of coffee.
Before moving on, let’s review some chemistry and define these measurements. The pH scale runs from 0 to 14, and is a measurement of the acidity of a solution with 0 being extremely acidic and 14 being extremely basic (pure distilled water will be neutral at a pH of 7).
The measurement is based on the concentration of hydrogen ions (H+) in solution, and is a logarithmic scale, where pH = −log[H+]. This means each step on the scale is a tenfold increase or decrease in acidity.[5]
The pH of coffee tends to fall between 4.5 and 6, depending on many factors including roast and brewing.
Titratable acidity is another way of measuring acidity. The key difference between how titratable acidity and pH are measured comes from understanding the chemical concept of “strong acids” and “weak acids.”
Weak acids, those found in coffee, do not “dissociate” (or release H+) fully in solution, but they still trigger the sour taste receptors on the tongue, contributing to perceived sourness of coffee and other food and beverage products.
Titratable acidity is the measurement of the volume of base (i.e., high pH solution, in this case sodium hydroxide or NaOH) required to adjust a set volume of coffee (in our case, 50 mL) to a set pH (here we chose 8.2).
Acids in coffee do contribute variably to the sensory profile of coffee—for example, quinic acid is more bitter than sour—but citric and acetic acid will contribute strongly to the sourness of the coffee.
While titratable acidity also captures these other variable acids, it is generally considered a good approximation for sourness.
For every coffee sample brewed for descriptive analysis and consumer testing, individual pH and titratable acidity measurements were taken, totaling 744 data points from 744 individual drip brews.
This was split across three experiments: the “roast” experiment, which was a descriptive analysis of nine TDS-PE combinations at three different roast levels (light, medium, and dark); the “temperature” experiment with the same nine TDS-PE combinations at three different brew temperatures (87°C, 90°C, and 93°C); and the “consumer” experiment, which was the same 27 samples as the temperature experiment, but evaluated for preference.
Replication and multiple tasting sessions for different panelists led to the high number of brews we had for this analysis.
What Did We Find?
The first major result we noticed was that pH had very little dependence on brew extraction.
This means that, while pH was shown to slightly decrease with TDS and increase with PE—which would have both resulted in an increased perceived acidity—other parameters had more of an impact.
For example, the roast experiment showed roast level to be a much bigger driver of difference in pH than brewing, and there was no difference in pH based on brew temperature.
Much more interestingly, titratable acidity showed a clear linear correlation to TDS, which is not a result that has been previously reported.
In the roast, temperature, and consumer experiments, an increase in TDS results in an increase in titratable acidity. Also interesting is the fact that titratable acidity appears to have no relationship with PE, indicating that strength of coffee is the main driver of coffee’s acidity.
The increase in titratable acidity is also reflected in the sensory results. Titratable acidity is shown to strongly correlate to perceived sourness in the descriptive analysis studies.
While no relationship was seen between pH and perceived sourness in the temperature experiment, it was weakly correlated negatively with sourness in the roast experiment.
The consumers were able to pick up on this as well, and the trends with TDS, titratable acidity, and sourness reflected the trends seen in the descriptive experiments.
Consumers rated acidity on a scale of “too little acidity,” “just-about-right,” and “too much acidity.” The selections of “too little” decreased with increases in TDS and titratable acidity, and selections of “too much” increased.
Consumer perception also interestingly had a relationship with pH, even though the descriptive analysis panel of the same samples did not. And in terms of consumer preference for acidity in general, the results were split.
The consumers were segmented into two different groups, with about half of consumers preferring more acidity in their coffee, and about half preferring less.
Complicated (But Cool)
And, if that wasn’t complicated enough, it gets worse! While there is a correlation between titratable acidity and sourness, the relationship titratable acidity and sourness respectively have with TDS and PE are not identical.
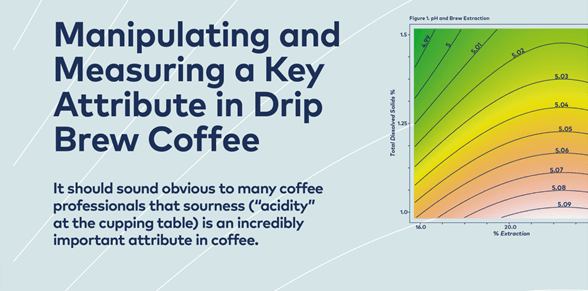
We can visualize this using three-dimensional contour plots known as “response surface maps” where PE is on the X axis and TDS is on the Y axis like the Coffee Brewing Control Chart, and the third variable (sourness or titratable acidity) is in the third dimension, color coded by intensity.
As you can see, sourness increases strongly with TDS and decreases with PE, peaking at high TDS, low PE and minimal at high PE, low TDS. With titratable acidity, there is still the same relationship with TDS, but the dependence on PE is much lower—a high TDS, high PE coffee will not be significantly less acidic than a high TDS, low PE coffee.
So where does this leave us? At a high level, TDS and titratable acidity have a clear correlation, and titratable acidity can (to a certain extent) predict sourness, at least more effectively than pH.
While pH is more accurate as a determinant of sourness by roast level, it changes little with brewing. Both titratable acidity and the resulting perceived sourness are impacted substantially by brewing—specifically by extraction—and the same coffee can be brewed to a very different level of acidity and sourness depending on TDS and PE.
And, understanding that there are two kinds of consumers—those who enjoy acidity and those who don’t—this may become an interesting tool for coffee purveyors to employ when appealing to a broad variety of customers or trying to pinpoint their customers’ demographic.
There is still more to understand regarding the relationship between sourness, titratable acidity, and percent extraction.
As we go forward, we hope to better understand the role of specific acids in the sensory profile of coffee, and further explore how titratable acidity can be used as a tool to predict coffee quality.
Notes and References
[1] Visit sca.coffee/brewing-research for a full list of these publications.
[2] The same green coffee, a wet washed arabica sourced from Siguatepeque, Comayagua, Honduras, was roasted to three different levels, representing a typical “light,” “medium,” and “dark” roast by varying development time post first crack. The green coffee comprised a mix of Bourbon, Catuai, Caturra, Lempira, Ihcafe 90, Pacas, and Typica varietals.
[3] For more detail, some of these experiments have been shared across scientific journals as well as plain-language features here in previous issues of 25. Turn to page 30 to learn more about a recent consumer preference experiment, or visit sca.coffee/brewing-research to learn more about all of the Brewing Fundamental project outputs.
[4] Cotter, A.R., Batali, M.E., Ristenpart, W.D., and Guinard J.-X. (2021), Consumer preferences for black coffee are spread over a wide range of brew strengths and extraction yields. Journal of Food Science. 2021 Jan 19;86(1):194–205.
[5] Learn more about the pH scale.


