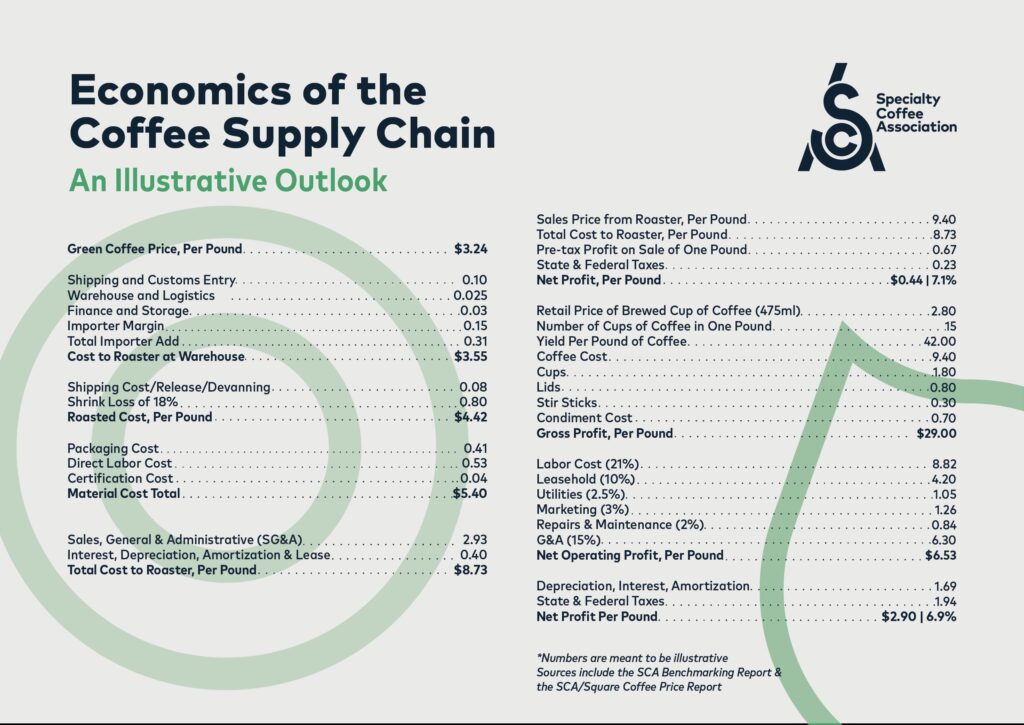
MILAN— The Specialty Coffee Association (SCA) has released an update to its table titled Economics of the Coffee Supply Chain: An Illustrative Outlook, a graphic that paints a broad representation of the specialty coffee value stream.
The data came from many sources, which were then aggregated to illustrate a typical supply chain. The exact amounts will vary based on many factors, such as location for example, but this Outlook represents accurately the ratios or proportions of the different parts of the value chain.
The updated table combines roaster, retailer, and importer data from various sources including the SCA Roaster and Retailer Benchmarking Study and the SCA/Square Coffee Reports.
The aim of this illustration is to show how value is distributed and how various costs enter into the economic picture of coffee.
SCA also hopes that it will serve as a constructive tool in the ongoing discussion around coffee production, pricing, and trading.
How can this illustration of the supply chain serve the coffee community?
- Coffee producers might use it to understand the business models of the importer, roaster, and coffee shop.
- Baristas and shop owners will be interested in understanding typical costs and risks of their partners.
- Anyone studying coffee might use this illustration to better understand the value chain and how value is distributed.
SCA research and market analysis is made possible thanks to the support of members of the SCA and donors of the Coffee Science Foundation, the SCA’s non-profit organization dedicated to advancing the understanding of coffee.
The new Outlook is available for free to SCA members and the public in the SCA Store here.







 CAPS: the new proprietary system using capsules made of 85% recycled aluminium


